
Named Storm Track Corridors
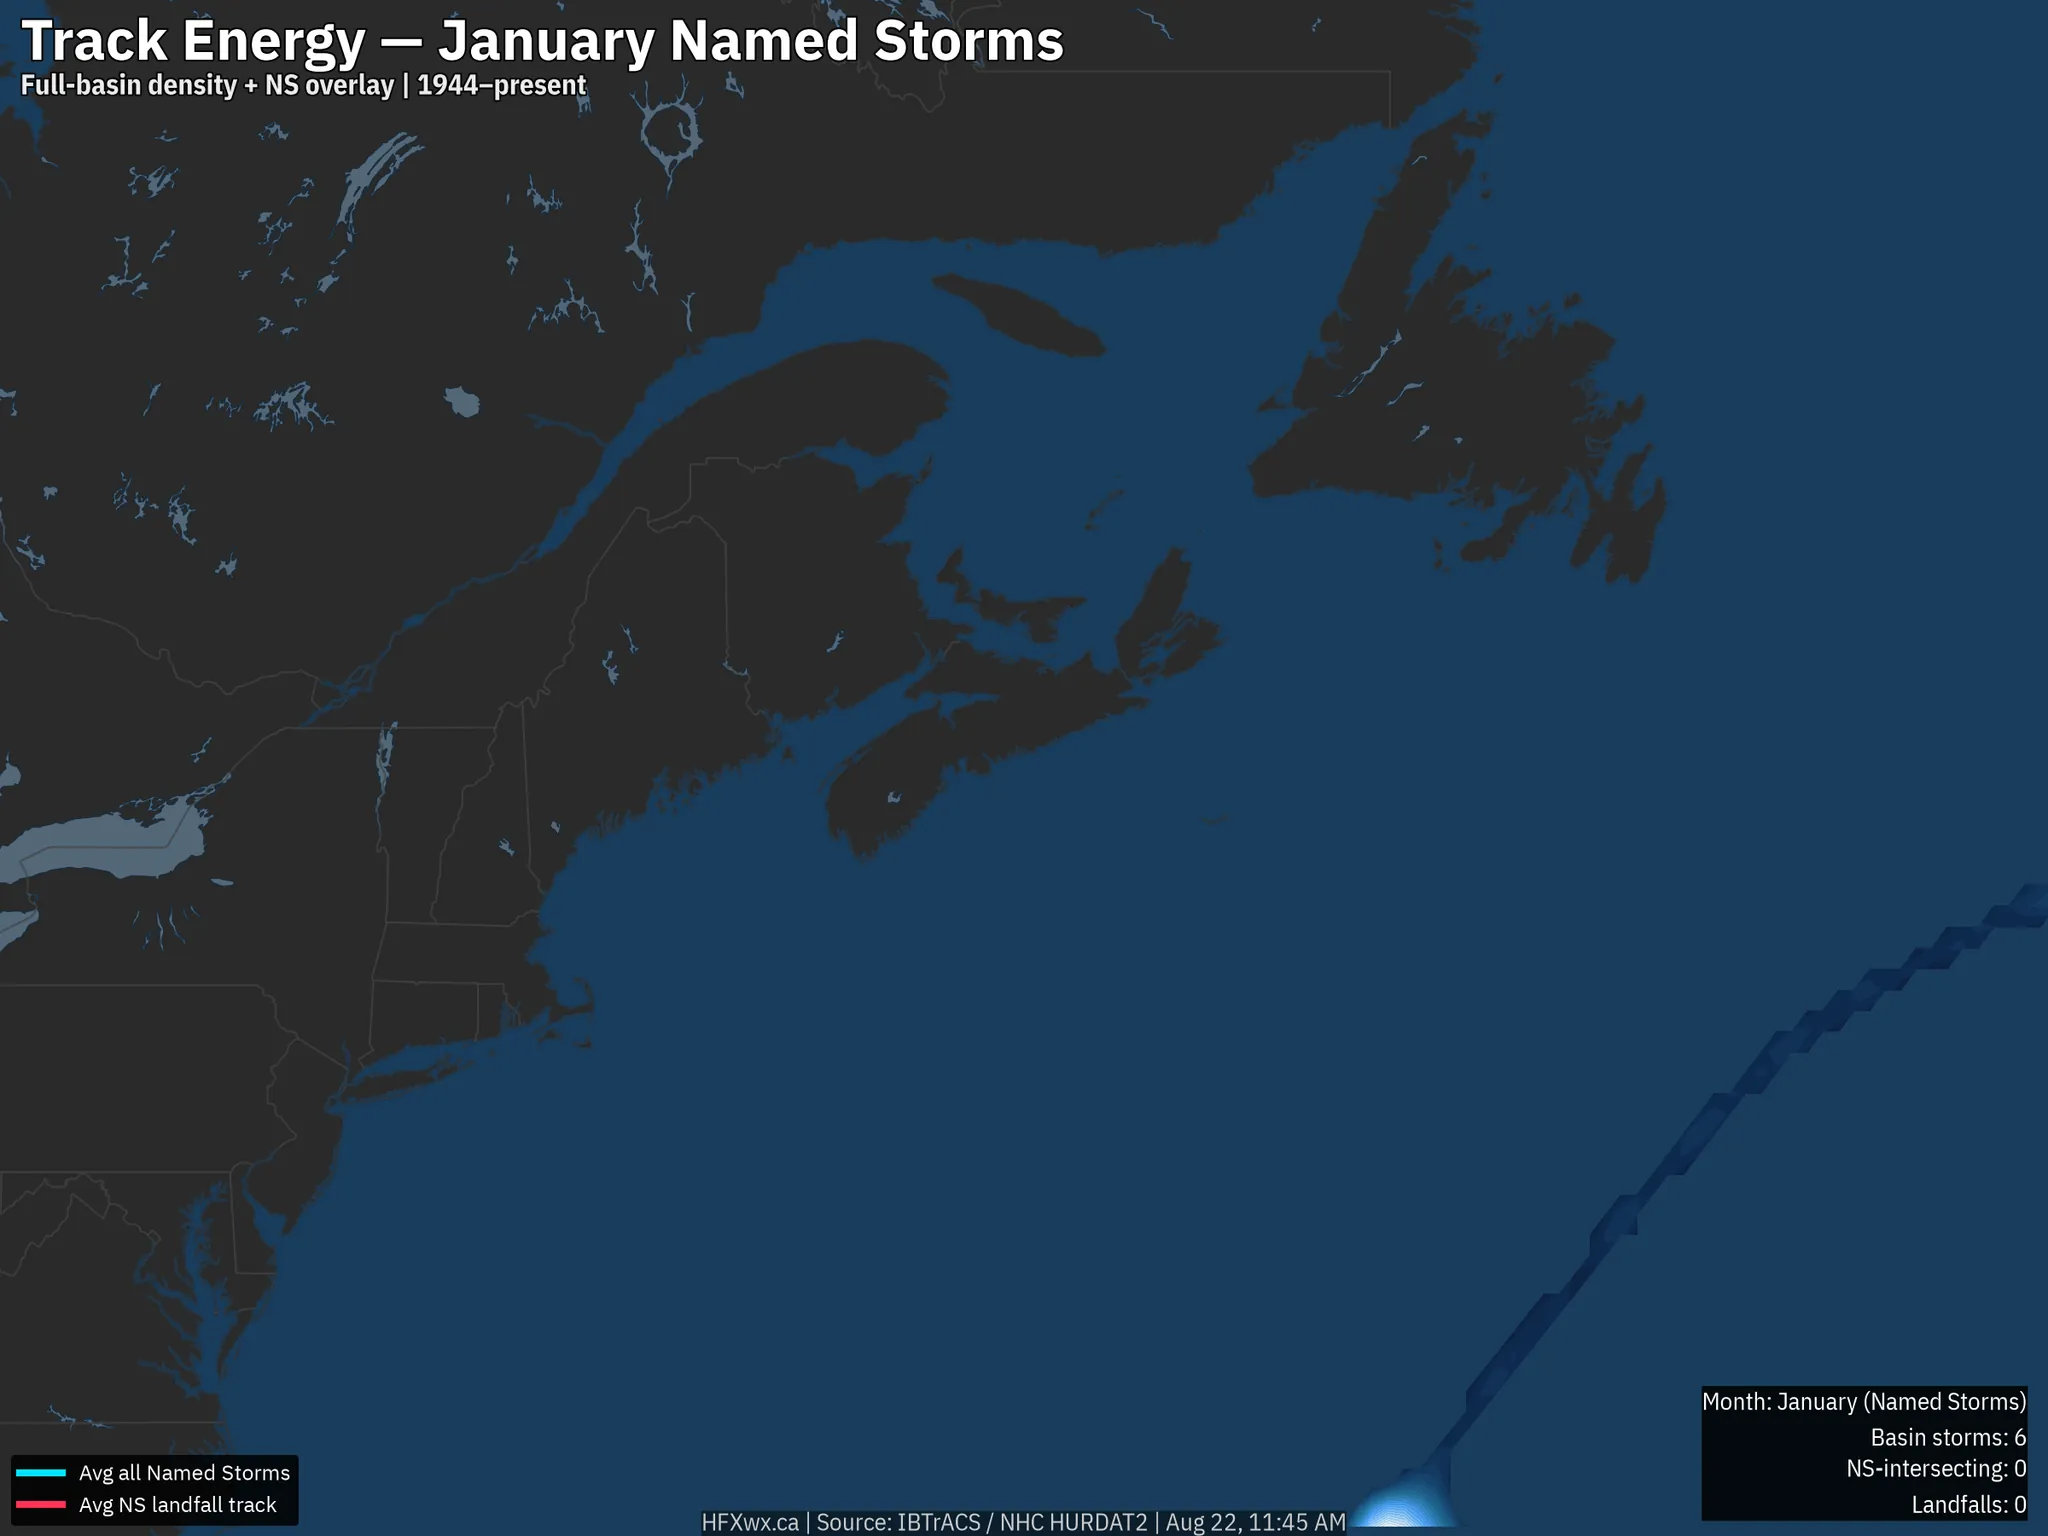
Average monthly track density for named storms (tropical-storm strength or stronger), 1944–present. Blue-to-white shading marks where storms tracked most often; the warm overlay highlights tracks that reached Nova Scotia. The cyan line is the mean path of all storms for the month; the red line is the mean path of storms that made Nova Scotia landfall.
| Month | Basin Tracks | NS Tracks | Landfalls | Near Passes | Peak /100yr |
|---|---|---|---|---|---|
| January | 6 | 0 | 0 | 0 | 2 |
| February | 1 | 0 | 0 | 0 | 1 |
| March | 1 | 0 | 0 | 0 | 0 |
| April | 3 | 0 | 0 | 0 | 1 |
| May | 37 | 2 | 1 | 1 | 4 |
| June | 123 | 10 | 3 | 7 | 9 |
| July | 156 | 18 | 6 | 12 | 9 |
| August | 465 | 14 | 6 | 8 | 14 |
| September | 744 | 32 | 14 | 18 | 21 |
| October | 450 | 22 | 10 | 12 | 17 |
| November | 128 | 3 | 2 | 1 | 5 |
| December | 25 | 0 | 0 | 0 | 2 |
Hurricane Track Corridors
As above, limited to hurricanes (64 kt or stronger). Signal is sparser this far north; where present, the corridors show the preferred hurricane approach paths and the average landfall track.
| Month | Basin Tracks | NS Tracks | Landfalls | Near Passes | Peak /100yr |
|---|---|---|---|---|---|
| January | 3 | 0 | 0 | 0 | 1 |
| February | 0 | 0 | 0 | 0 | 0 |
| March | 1 | 0 | 0 | 0 | 0 |
| April | 0 | 0 | 0 | 0 | 0 |
| May | 6 | 0 | 0 | 0 | 2 |
| June | 39 | 4 | 2 | 2 | 4 |
| July | 78 | 10 | 2 | 8 | 5 |
| August | 295 | 10 | 4 | 6 | 12 |
| September | 488 | 28 | 14 | 14 | 17 |
| October | 272 | 16 | 8 | 8 | 11 |
| November | 69 | 2 | 2 | 0 | 3 |
| December | 11 | 0 | 0 | 0 | 2 |