
Data Ingestion and Quality Control Methodology
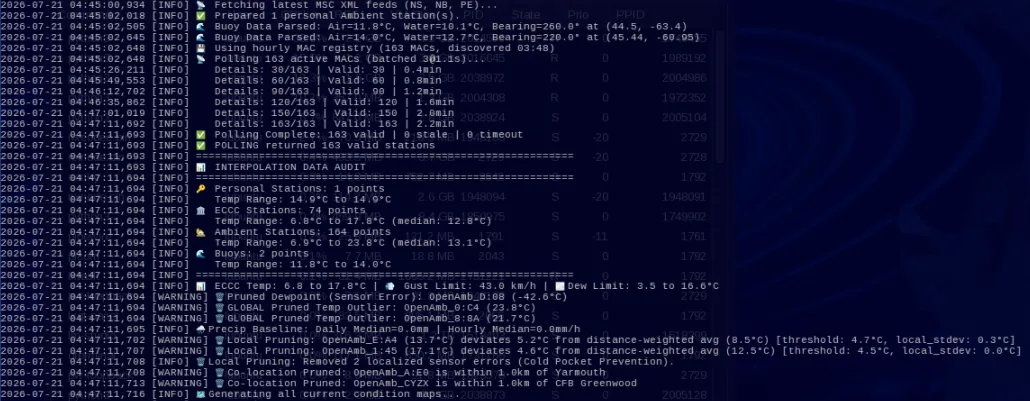
Personal Weather Station (PWS) data can be susceptible to micro-climate effects. This can be beneficial when micro-climate effects are exactly what you want to examine, yet sensor degradation or other errors can sometimes be hard to decouple from natural variation. To ensure reliability, local PWS stations are subjected to an hourly census and a strict, sequential Quality Control (QC) pipeline.
Data is processed in the following order before it is approved:
Step 1: Global Clamping and Spatial Pruning The first line of defense anchors PWS data against the official Environment Canada (ECCC) and marine buoy network.
- Global Clamping: The absolute minimum and maximum temperatures recorded by the official ECCC network are calculated. Any PWS reading falling outside this regional baseline (with a tight ±2.0°C tolerance) is instantly discarded.
- Distance-Weighted Spatial Pruning: For each PWS, nearby official stations within a 35km radius are identified. A distance-weighted average is calculated, and an adaptive threshold (based on the local standard deviation of the official network) is applied. If a PWS deviates beyond this dynamic threshold, it is flagged as a localized anomaly and pruned.
Step 2: Physical and Thermodynamic Consistency Before statistical modeling, the data is checked for physical impossibilities and internal logical contradictions.
- Physical Limits: Readings that fall outside the bounds of regional norms are instantly discarded (e.g., dew points below -35°C or above 35°C).
- Thermodynamic Law: The relationship between temperature and dew point is strictly enforced. If a station reports a dew point that exceeds the ambient air temperature (allowing a 1.0°C buffer for sensor noise), the data point is rejected.
Step 3: Co-location Pruning To help prevent mathematical singularities during the interpolation phase, strict spatial separation is enforced.
- The Process: Any PWS located within 1.0km of an official ECCC site is automatically removed from the interpolation dataset. This ensures highly calibrated official instruments take precedence in their immediate vicinity without conflicting with a nearby PWS.
Step 4: Consensus-Based Pruning (For Ungauged Variables) While temperature can be verified against ECCC ground-truths, precipitation data (rain rate, daily/monthly totals) and wind gusts from PWS lack this guidepost. For these variables, a multi-tiered Median Consensus Algorithm is used.
- Global Median Filtering: The network-wide median for daily and hourly precipitation is calculated. This instantly prunes more obvious hardware failures and other errors.
- Local Spatial Consensus: For variables like current rain rate, PWS are grouped into localized 25km spatial clusters to create a local cluster consensus as a guide.
Step 5: Staleness and Final Aggregation
- Temporal Staleness: Any PWS that has not updated since the last cycle is dropped from the census until the next one to ensure the map reflects the most current conditions.
- Final Aggregation: Only data that successfully passes all stages of the QC pipeline is retained. This pruned dataset is then interpolated using Thin Plate Spline (TPS) and rendered, helping ensure the most accurate representation possible. This ingestion and QC process occurs every 15 minutes.